APANA™ – Customer Analytics Site
The Client
APANA™ is an IOT startup which uses cutting edge wireless technology to collect water usage data from large retail outlets such as Costco and Walmart. Not only do they provide real time analysis to alert clients if there is a water leak, they provide analytics to gain insight into how to reduce overall water usage.
The Problem
APANA™ engineers had solved the problem of gathering all of this data, but had only piecemeal ways of conveying water usage to clients. The goal of the customer analytics site was to put this data together in an easily navigable and digestible overview of all of their sites worldwide.
The Solution
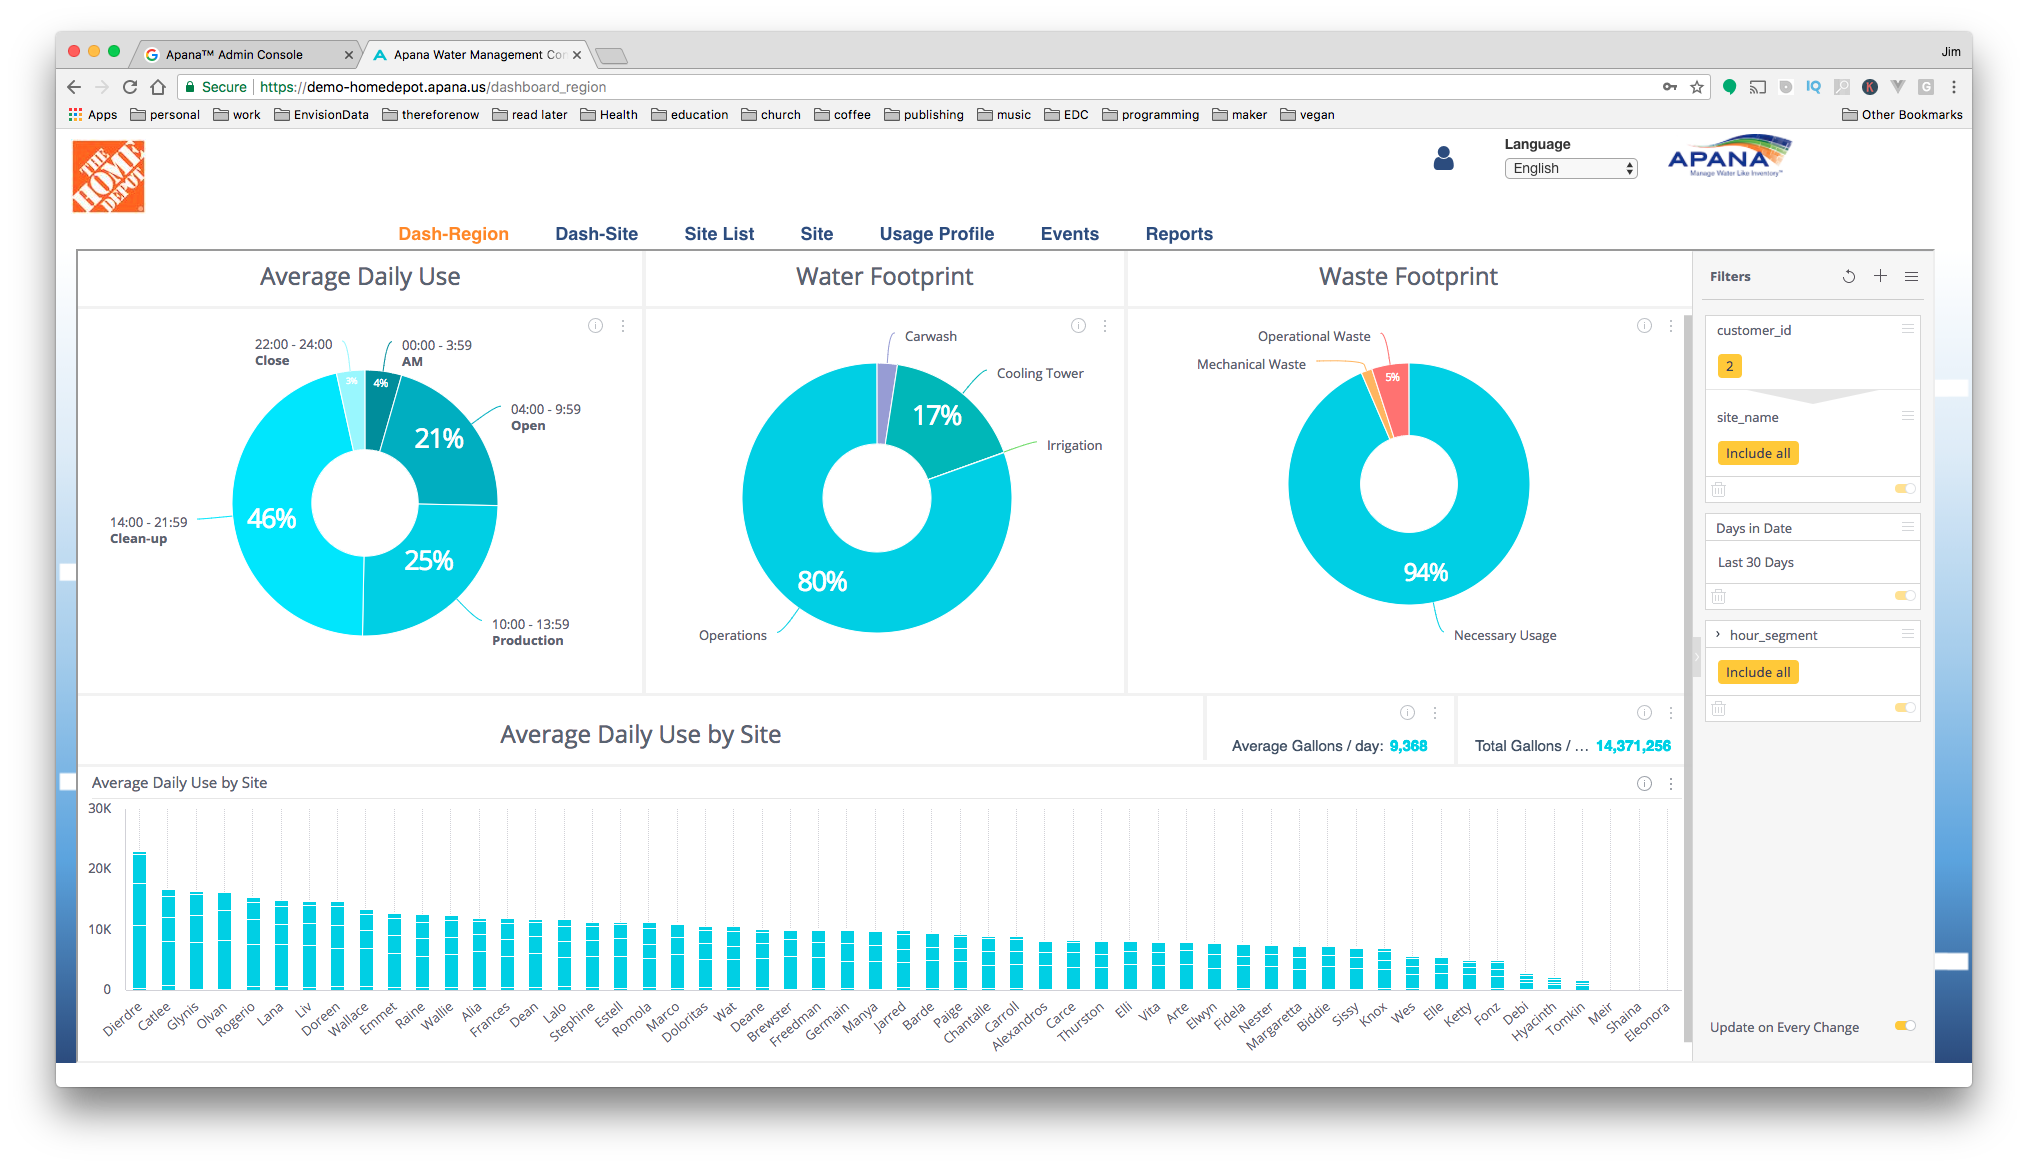
Using Wireframes and data models with the Sisense data analytics visualization tools and my abundant SQL kung fu, I designed and built a single multi-language site to browse the water usage across all of a customer’s physical sites in aggregate, as well as per individual site.
The Success
The site was successfully deployed, and was in use by a Japanese company who ended up investing heavily in APANA™, and I believe the site helped to convince them.